Wall Putty Raw Material Processing
Understanding Particle-Size Distribution in Mineral Powders
2026-10-20 09:44:47

Particle-size distribution describes how much of a powder falls within different particle-size ranges. Unlike a single fineness value, it shows whether the material contains a relatively narrow population of particles, a broad mixture of sizes, or distinct fine and coarse fractions. For mineral powders used in wall putty, that information helps explain why apparently similar fillers can behave differently during mixing and application.
The key is distribution: knowing the median particle size is useful, but understanding what lies on either side of it is essential when controlling water demand, surface texture, and coarse-particle defects.
Read the Report Before Comparing the Numbers
A particle-size report should identify both the measurement method and the basis on which the results are expressed. A distribution based on particle volume is not the same as one based on particle count. Laser diffraction commonly reports a volume-based distribution, meaning that the reported percentages refer to particle volume rather than the number of individual particles.
This distinction matters because a relatively small number of large particles can represent a meaningful share of the total volume. Comparing results from different measurement bases without recognizing that difference can lead to an incorrect assessment of the powder.
Before accepting or comparing a report, check:
The measurement technique used.
Whether the distribution is volume-based, number-based, or expressed on another basis.
How the sample was prepared and dispersed.
Whether the same procedure was used for the reference and candidate powders.
Whether the report includes the full distribution as well as summary values.
What Dv10, Dv50, and Dv90 Actually Mean
These values identify positions within a cumulative volume distribution. They describe the particle sizes below which specified proportions of the sample volume fall. Dv50 is the volume median, not the arithmetic average of individual particle diameters.
| Reported Value | Meaning | Practical Use |
|---|---|---|
| Dv10 | The size below which 10% of the particle volume falls | Helps track changes toward the fine end of the distribution |
| Dv50 | The size below which 50% of the particle volume falls | Provides a convenient indicator of the central position of the distribution |
| Dv90 | The size below which 90% of the particle volume falls | Helps monitor changes toward the coarse end of the distribution |
Each value describes a different part of the same distribution. None is a complete specification on its own. In particular, Dv90 is not a maximum particle size: some particle volume remains above that value.
An Illustrative Comparison
Consider two hypothetical mineral powders with the following volume-based results. These figures illustrate how to read a report; they are not recommended specifications for wall putty.
| Powder | Dv10 | Dv50 | Dv90 |
|---|---|---|---|
| Powder A | 2 micrometers | 10 micrometers | 25 micrometers |
| Powder B | 1 micrometer | 10 micrometers | 45 micrometers |
Both powders have the same median, but Powder B extends further toward both smaller and larger sizes at the reported percentiles. They should not be considered equivalent merely because their Dv50 values match. The full curves would provide further information about where the particle volume is concentrated.
What the Distribution Curve Adds
A frequency distribution shows how much material occurs within each size interval. A cumulative distribution shows how much lies below a particular size. The two presentations describe the same population in different ways, but they answer different practical questions.
Use the frequency curve to inspect where particle populations are concentrated and whether there are distinct peaks.
Use the cumulative curve to read the proportion below an agreed size or compare percentile positions.
Review both when summary values appear satisfactory but application behavior has changed.
A narrow curve is not automatically superior to a broad one. In mineral-filled systems, smaller particles can occupy spaces between larger particles, influencing packing. However, the useful distribution depends on the proportions involved and the requirements of the finished formulation. Packing research on limestone fines demonstrates that the amount of fine material matters alongside its presence.
Why the Coarse Tail Matters in Wall Putty
The coarse tail is the portion extending toward larger particle sizes. For a thin finishing layer, this part of the distribution deserves particular attention because occasional oversized particles can interfere with blade movement or remain visible in the surface.
A percentile result alone cannot establish that the powder is free from troublesome grit. Dv90, for example, leaves 10% of the measured particle volume above the reported size. Even a higher percentile should not be interpreted as proof that no larger particles exist.
Where surface defects are critical, combine the particle-size report with an agreed coarse-residue test and an application trial. If retained material is found, inspect it. A hard mineral grain, a loose agglomerate, and contamination from conveying equipment may produce similar symptoms but require different corrective actions.
The Fine Fraction Also Needs Attention
Very fine particles influence the surface area available to interact with water and formulation ingredients. At the same time, the way different sizes pack together affects how much liquid remains available for flow. These competing effects help explain why finer powder does not always produce easier spreading.
Particle-size distribution is therefore an important diagnostic tool, but it is not a direct measurement of water demand. Mineral composition, particle shape, surface characteristics, and additives also contribute. Compare candidate powders in the actual putty rather than predicting performance from Dv10 or Dv50 alone.
Measurement Conditions Can Change the Result
Laser diffraction measures the scattering pattern from a population of dispersed particles and uses an optical model to report particle sizes. It does not directly photograph and measure every individual grain. For irregular or plate-like minerals, the reported size should not be read as a complete description of particle length, width, or thickness.
Dispersion is especially important. A powder may contain particles grouped into agglomerates, and the preparation procedure influences whether those groups remain together during measurement. Changes associated with dispersion or agglomeration can appear in repeated particle-size results.
For reliable routine comparisons, establish a written procedure covering:
Sample collection and representative subdivision.
Dry or wet measurement conditions.
The dispersion procedure and any dispersant used.
Instrument settings and optical parameters appropriate to the material.
Repeat measurements and acceptance checks.
Use that procedure consistently for supplier approval, incoming inspection, and production control. If two laboratories disagree, compare their methods before concluding that the material has changed.
Turn the Approved Distribution into a Production Target
Once a powder performs satisfactorily in wall putty, retain its full distribution as a reference rather than recording only its nominal mesh grade. Establish practical acceptance ranges using repeat measurements and production lots.
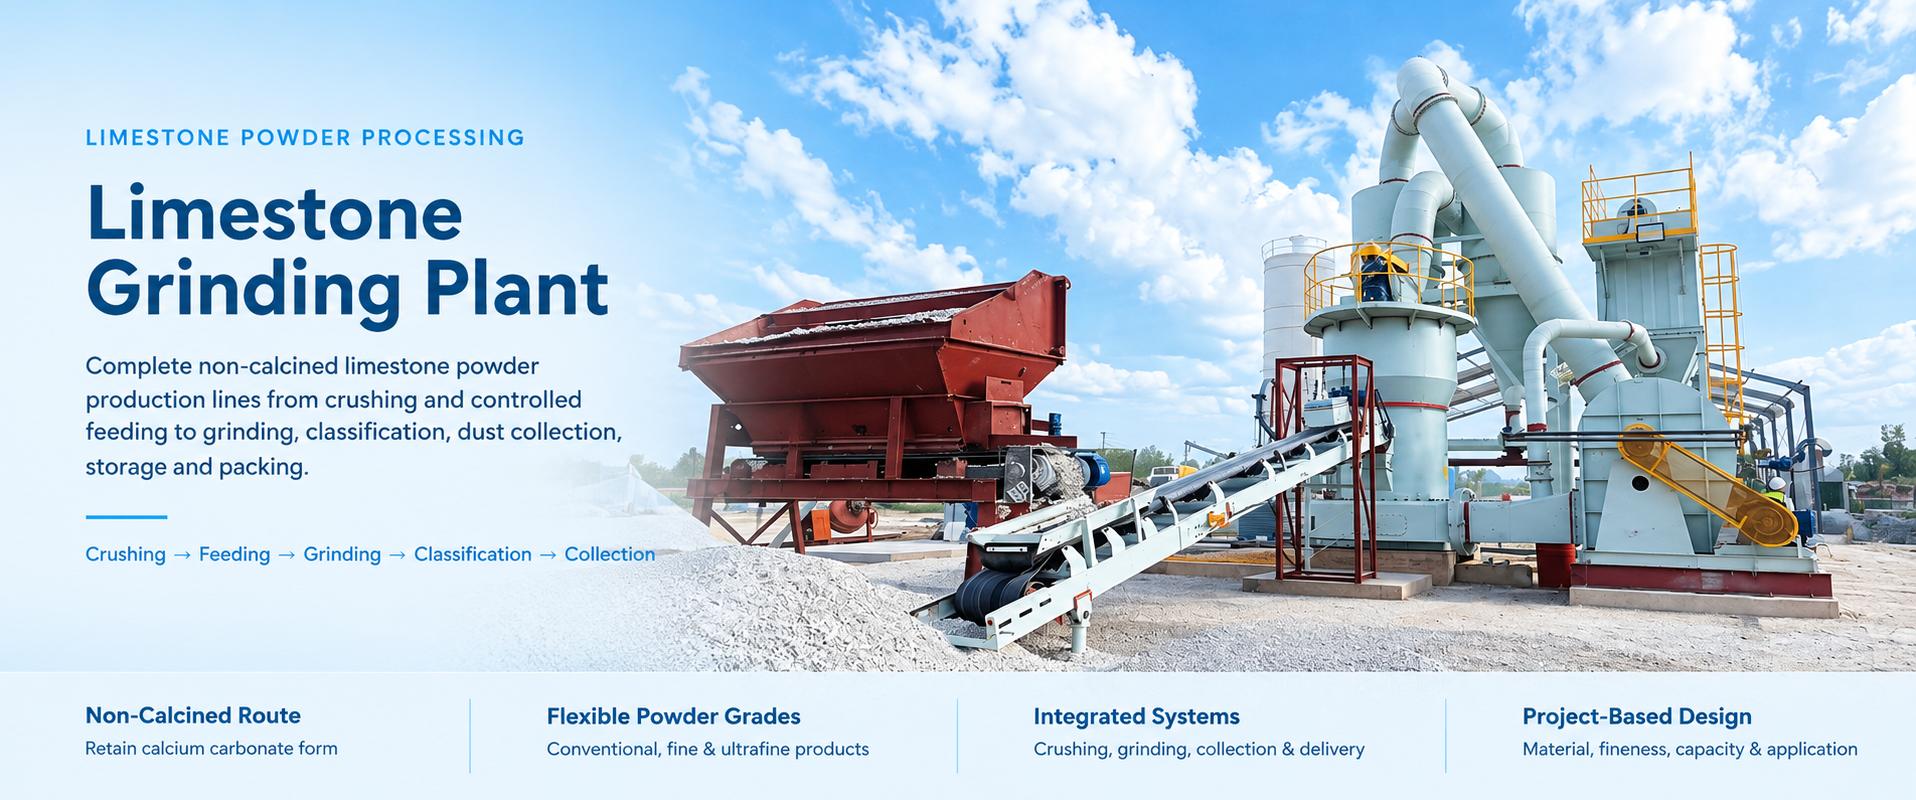
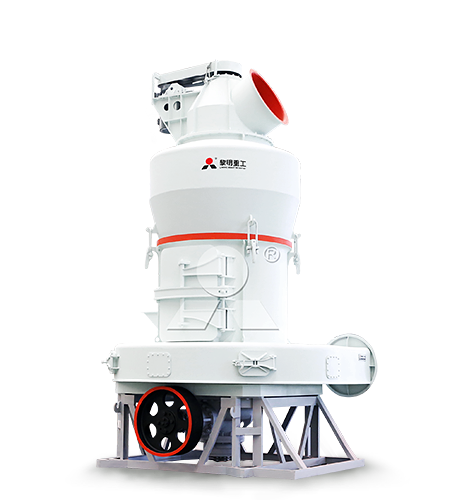
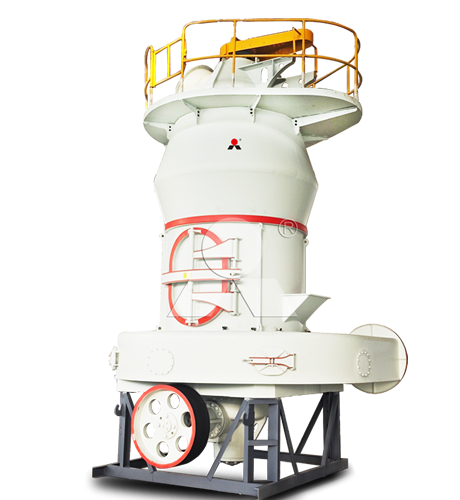
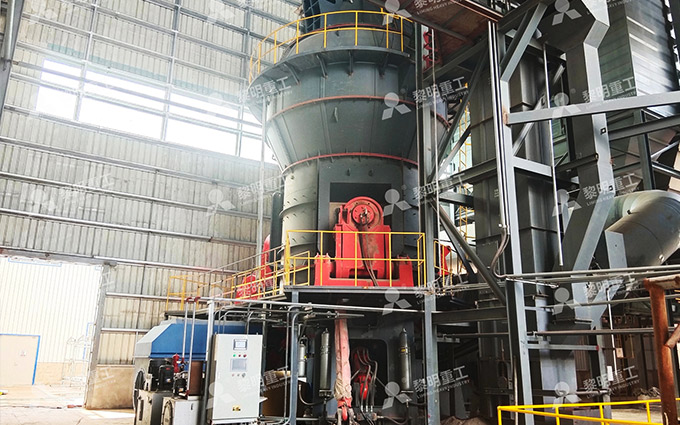
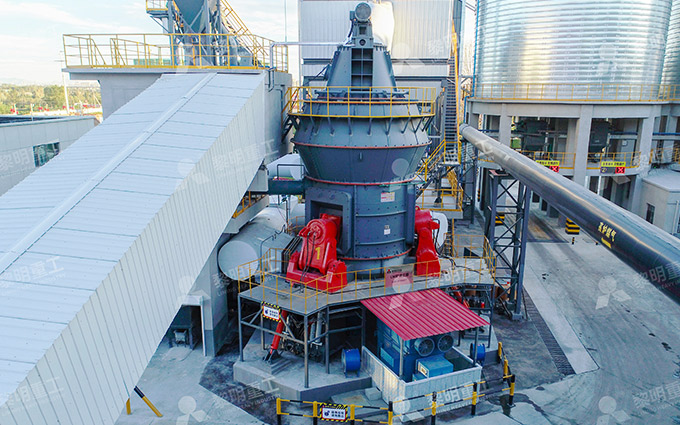
Grinding and classification work together to maintain that target. In a classified grinding circuit, particles that do not meet the required fineness return for further grinding, while acceptable material passes to collection. Liming Heavy Industry describes this operating sequence in its MTW-series grinding equipment.
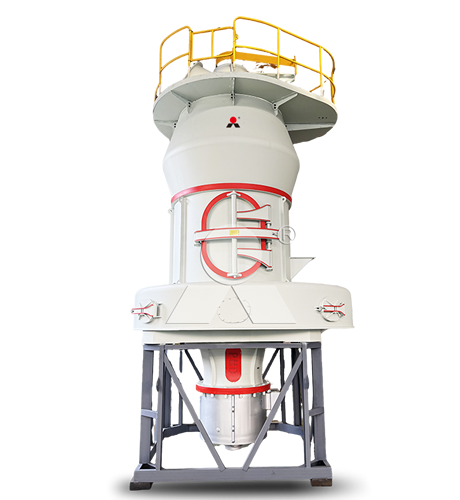
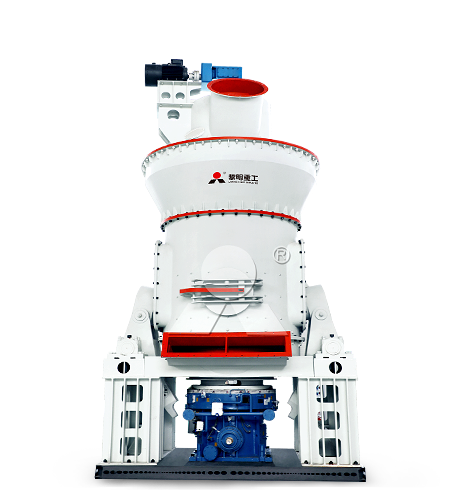
For a new mineral-powder project, Liming Heavy Industry MTW European Trapezium Mills can be evaluated for conventional fine grinding, while Liming Heavy Industry LUM Ultrafine Vertical Mills can be evaluated where the approved product requires ultrafine processing. Selection should be based on representative feed material, the complete target distribution, and required saleable output.
A useful equipment brief includes more than “produce a fine powder.” Provide the approved reference, percentile limits, coarse-residue requirement, feed condition, and hourly production target. This gives the grinding trial a measurable objective.
A Practical Checklist for Powder Approval
Confirm that the sample represents normal production rather than a specially selected batch.
Check the measurement method and distribution basis before comparing figures.
Review Dv10, Dv50, and Dv90 together with the full curve.
Use a separate residue check where oversized particles could damage the finish.
Compare the powder with the approved reference in the actual putty formulation.
Confirm consistency across repeat batches before finalizing acceptance limits.
A well-defined particle-size distribution connects the powder specification, grinding process, and finished putty. Its value is not simply that it provides more numbers; it helps identify which part of the powder has changed and whether that change matters in use.